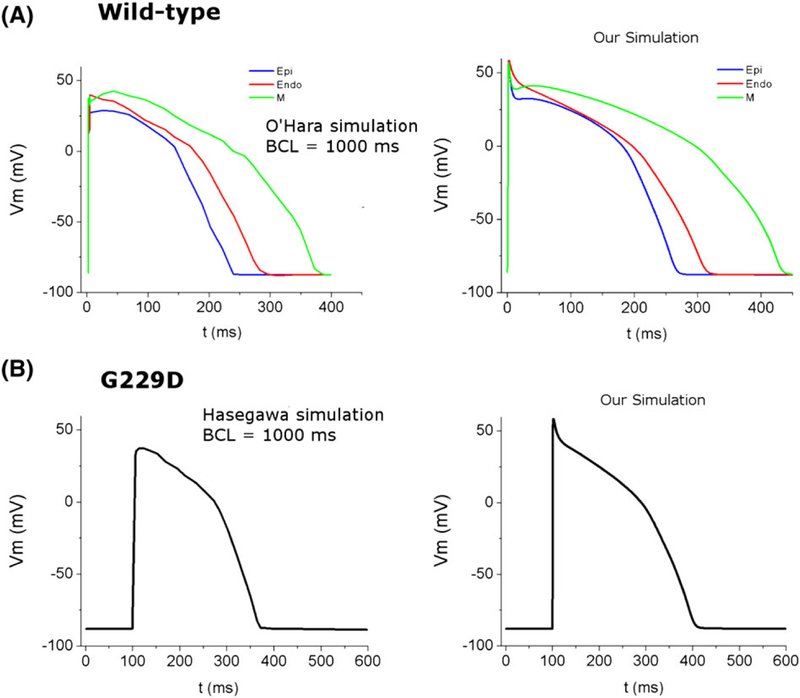
FIGURE 5.
Comparison of action potential (AP) shapes taken from the reference studies and recent simulation. A, AP shape for wild type condition with 3 cell types (red is endo, green is M-cell, and blue is epi) from previous simulation study of O’Hara et al1 (left) and our simulation (right); B, AP shape for G229D mutation condition with endo cell from previous simulation of Hasegawa et al7 (left) and our simulation (right). The basic cycle length is 1000 ms.

