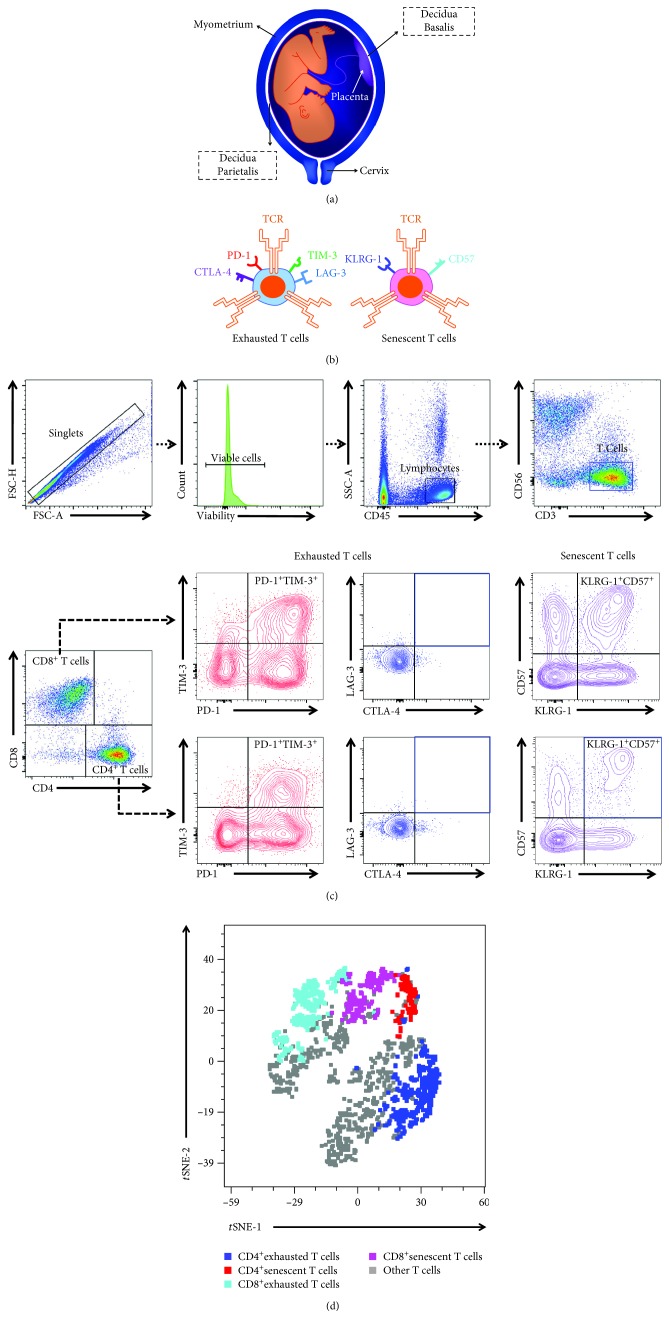
Figure 1.
Immunophenotyping of exhausted and senescent T cells in the decidua basalis and decidua parietalis. (a) Representation of the spatial localization of the decidua basalis and decidua parietalis. (b) Schematic representation of select markers expressed by exhausted and senescent T cells. (c) Flow cytometry gating strategy used to identify exhausted and senescent T cells in the decidual tissues. T cells were gated as CD3+CD56− cells within the viability and lymphocytic gates, followed by gating for the CD4+ and CD8+ subsets. Exhausted T cells were gated for expression of PD-1, TIM-3, CTLA-4, and LAG-3. Since expression of CTLA-4 and LAG-3 was low, exhausted T cells were defined as PD-1+TIM-3+ cells within the CD4+ or CD8+ gates. Senescent T cells were gated as KLRG-1+CD57+ cells within the CD4+ or CD8+ gates. (d) A representative t-distributed stochastic neighbor embedding (t-SNE) dot plot visualizing exhausted and senescent CD4+ and CD8+ T cells among decidual T cells. Blue—CD4+ exhausted T cells, red—CD4+ senescent T cells, turquoise—CD8+ exhausted T cells, pink—CD8+ senescent T cells, and grey—other T cells.

