Figure 6.
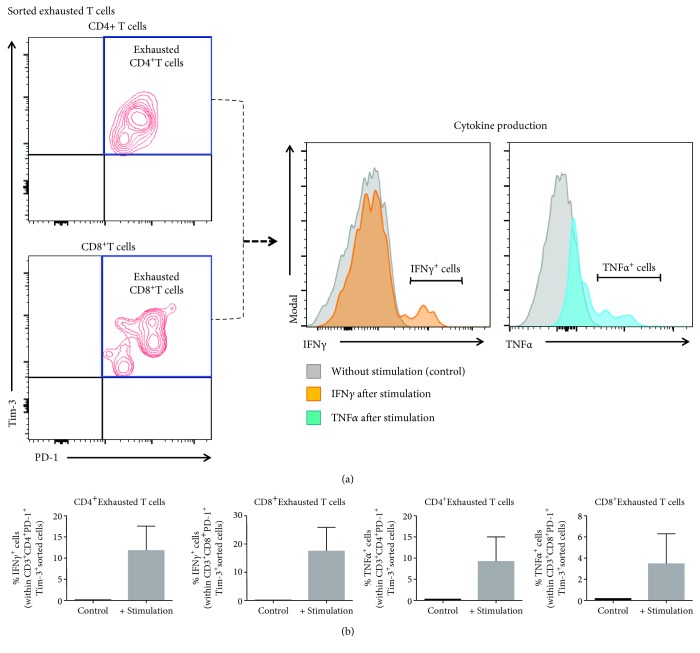
Determination of exhausted T cell functionality upon in vitro stimulation. (a) Gating strategy used to determine the purity of sorted CD4+ and CD8+ exhausted decidual T cells. Histograms show the production of IFNγ (orange histogram) and TNFα (blue histogram) by sorted exhausted T cells after in vitro stimulation. Grey histograms indicate nonstimulated controls. (b) Proportions of sorted exhausted CD4+ and CD8+ decidual T cells expressing IFNγ or TNFα after in vitro stimulation compared to nonstimulated controls. N = 3. Data are shown as the means with a standard error of the mean.

