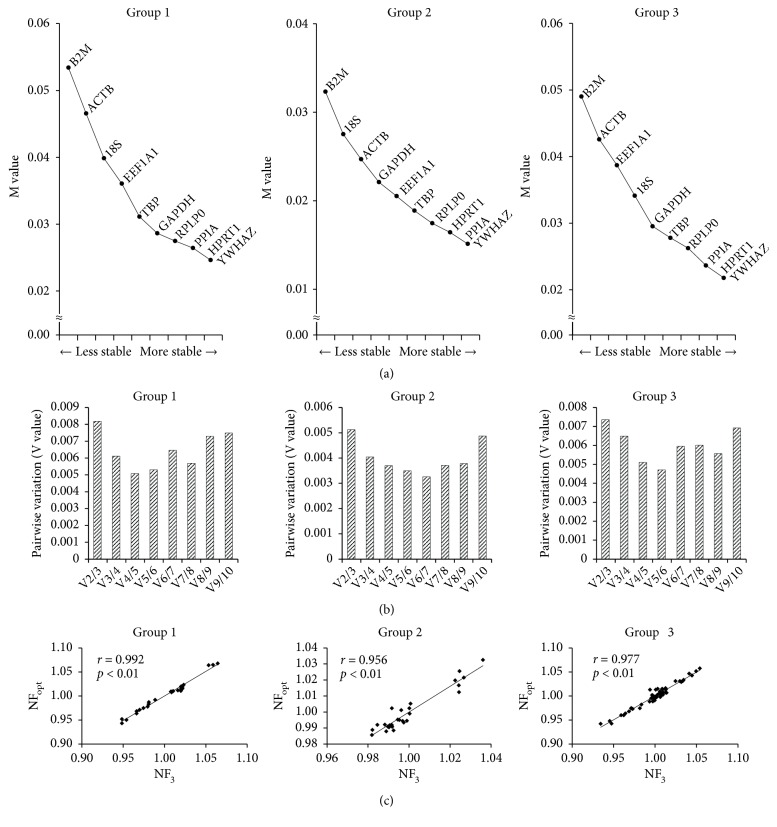
Figure 3.
Analysis of the most stable reference gene by geNorm. (a) Stability ranking of RGs for normalization. M values were used to determine ranking of the stability of RGs where lower value indicates higher stability. (b) Optimal number of reference genes for normalization (NFopt). The Pairwise variation (V value) was used to determine the optimal number of RGs where lower V value indicates optimal number of RGs for normalization. The value after V on the x-axis represents the number of RGs used. (c) Correlation between NFopt and NF3. Pearson's correlation was used to analyze correlation between NFopt and NF3. NF3, the three most stable RGs for normalization. Group 1 or 2 or 3, the validation of the most stable RGs in largely expanded BM-MSCs or UCB-MSCs or BM- and UCB-MSCs, respectively.

