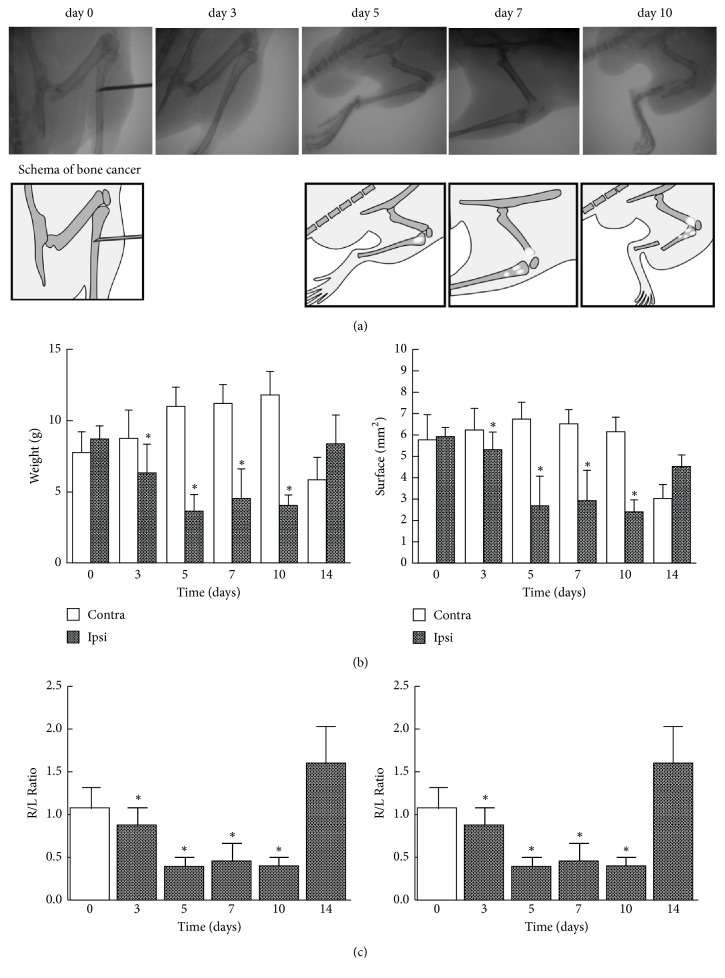
Figure 2.
Preparation of bone cancer pain mice and time courses of cancer pain as assessed by weight bearing and surface resting of hind paws. (a) Radiographs of progressive bone destruction. These images are representative of the stages of bone destruction in the right tibia. (b, c) Animal body weight bearing and surface resting of right and left hind paws were measured for 5 min on the indicated days with the DWB device as described in “Materials and Methods.” Day 0 represents the presurgical baseline data. The data are expressed as the mean ± SD (n = 6 except for n =4 on day 14). One-way repeated ANOVA was applied for statistical analysis. ∗P < 0.05 compared to left paw (b); ∗P < 0.05 compared to the R/L ratio of day 0 (c) [label ordinate for the right-hand graph].

