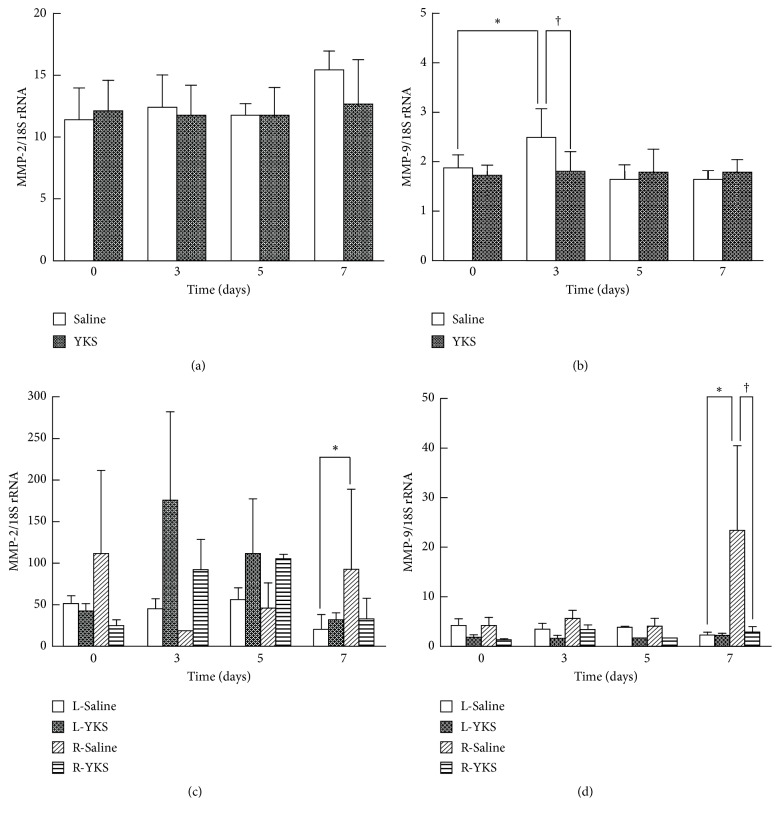
Figure 6.
RT-PCR analysis of MMP-2 and MMP-9 expression levels. YKS (10 mg) or saline was p.o. administered once daily to mice injected with 4T1 cells, and the right tibia (a, b) and the left and right halves of spinal cord (c, d) of the mice were dissected on the indicated days. RT-PCR was carried out as described in “Materials and Methods.” mRNA expression of MMP-2 (a, c) and MMP-9 (b, d) was normalized to that of GAPDH, and the data are expressed as the mean ± SD (n=3). Student's t-test was applied for statistical analysis. ∗P < 0.05 compared to day 0 (b) or to left halves of spinal cord (d). †P < 0.05 compared to YKS.

