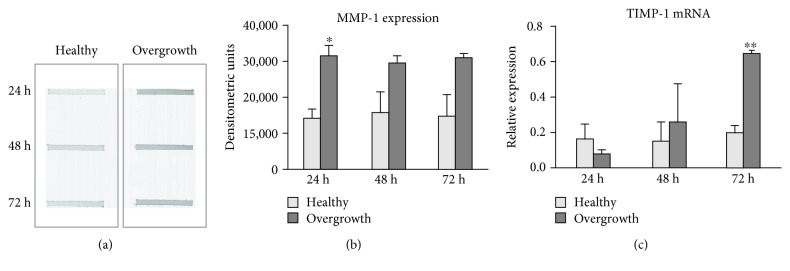
Figure 6.
MMP-1 and TIMP-1 expression. (a) Representative slot blot showing MMP-1 levels in serum-free cell culture supernatants of fibroblasts from healthy and overgrown gingivae. Immunoreactive bands were quantified by densitometric scanning as described in Materials and Methods. (b) Bar graphs showing MMP-1 protein levels analyzed by slot blot. Data are expressed as densitometric units and are mean ± SD for samples run in duplicate. (c) Bar graphs showing TIMP-1 gene expression after normalization on GAPDH mRNA levels. Data are expressed as mean ± SD for samples run in triplicate. ∗p < 0.05 and ∗∗p < 0.001.

