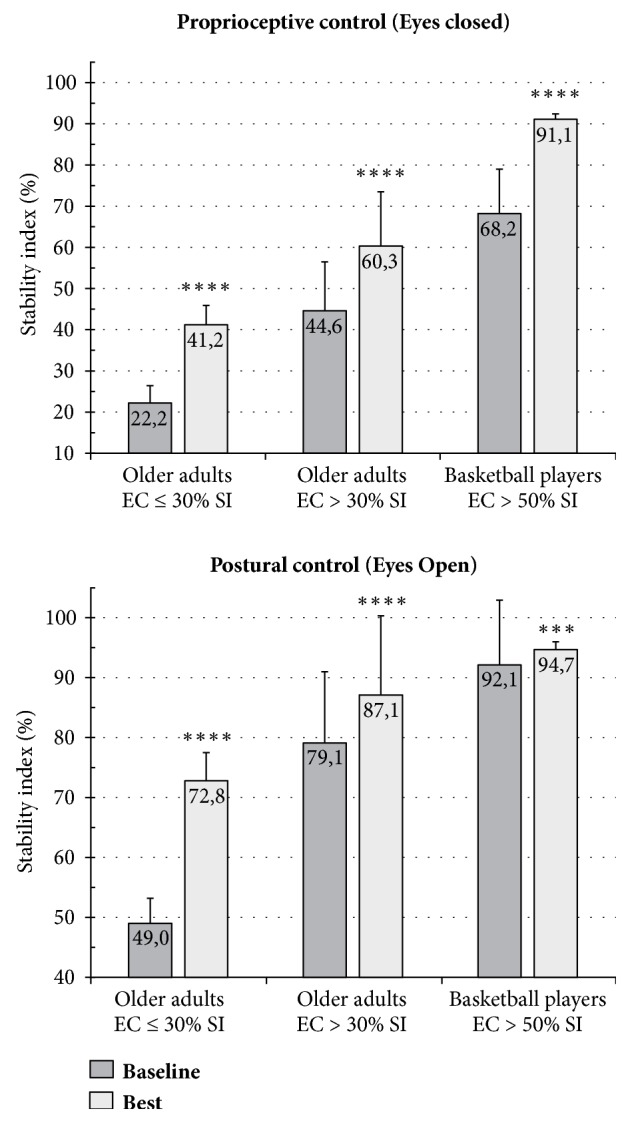
Figure 3.

Static single stance test. Variations in proprioceptive control and postural control after 6 weeks of high-frequency proprioceptive training in three groups with different starting levels of proprioceptive control. EC = eyes closed. SI = stability index. Mean values ± SD; ∗∗∗∗p < 0.001, ∗∗∗p < 0.005.
