
Figure 1.
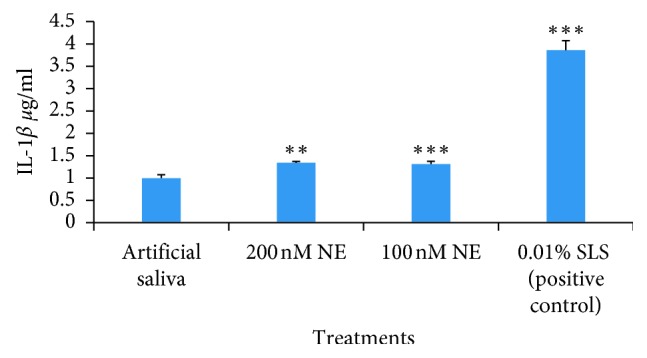
The graph depicting the concentration of IL-1β following the treatment of OMM samples with artificial saliva, 200 nM NE, 100 nM NE, and 0.01% SLS (P < 0.01∗∗, P < 0.001∗∗∗) for 24 hours.
Official websites use .gov
A
.gov website belongs to an official
government organization in the United States.
Secure .gov websites use HTTPS
A lock (
) or https:// means you've safely
connected to the .gov website. Share sensitive
information only on official, secure websites.
The graph depicting the concentration of IL-1β following the treatment of OMM samples with artificial saliva, 200 nM NE, 100 nM NE, and 0.01% SLS (P < 0.01∗∗, P < 0.001∗∗∗) for 24 hours.