Figure 1.

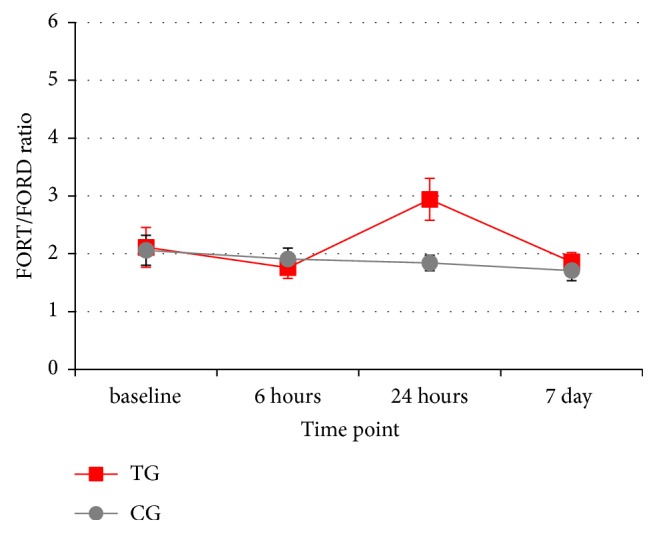
Mean values and standard errors of the longitudinal changes of the FORT/FORD ratio in the treated (TG) and control (CG) groups.

Mean values and standard errors of the longitudinal changes of the FORT/FORD ratio in the treated (TG) and control (CG) groups.