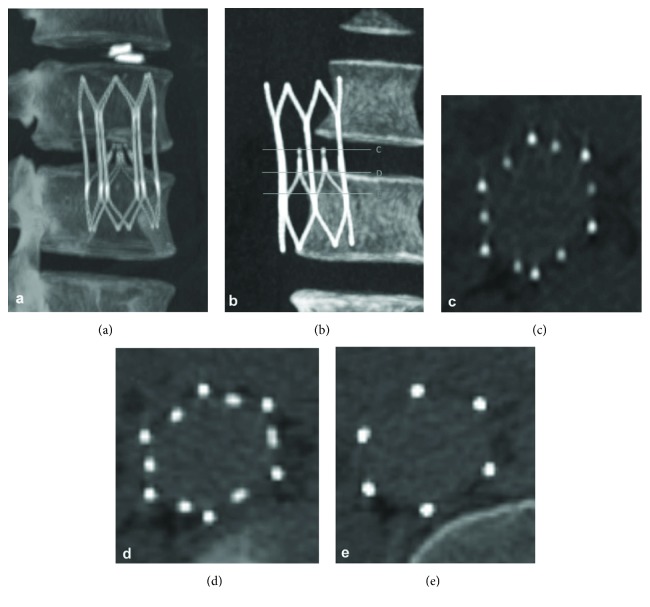
Figure 4.
Computed tomography imaging of the Sentry bioconvertible IVC filter for a single patient. (a) Coronal image acquired as part of helical dataset 1 month after filter placement, showing the Sentry device in filtering configuration. (b) Coronal image at 6-month follow-up showing the device in bioconverted configuration. ((c), (d), (e)) Axial views of the bioconverted device at 6-month follow-up, with the images keyed to the coronal view in (b). Reprinted with permission from Dake et al. [60]

