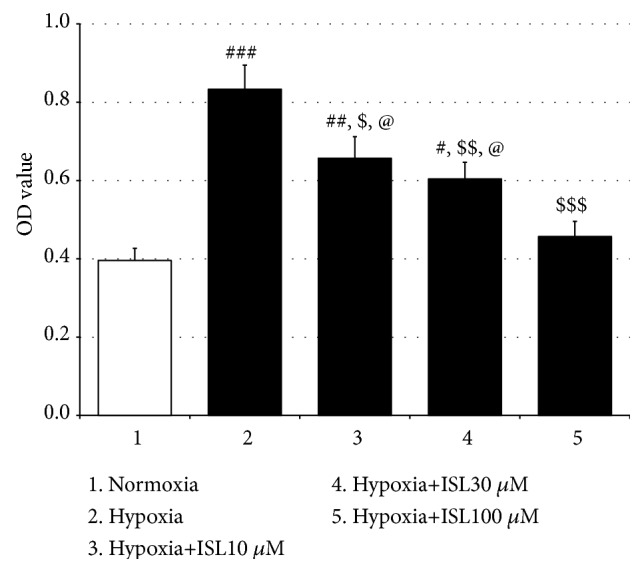
Figure 7.

Effects of ISL on hypoxia-induced PASMCs proliferation. Values are means ± SEM (n = 5). # p < 0.05, ## p < 0.01, and ### p < 0.001, compared with normoxia group; $ p < 0.05, $$ p < 0.01, and $$$ p < 0.001, compared with hypoxia group; @ p < 0.05, compared with Hypoxia+ISL 100 μM group.
