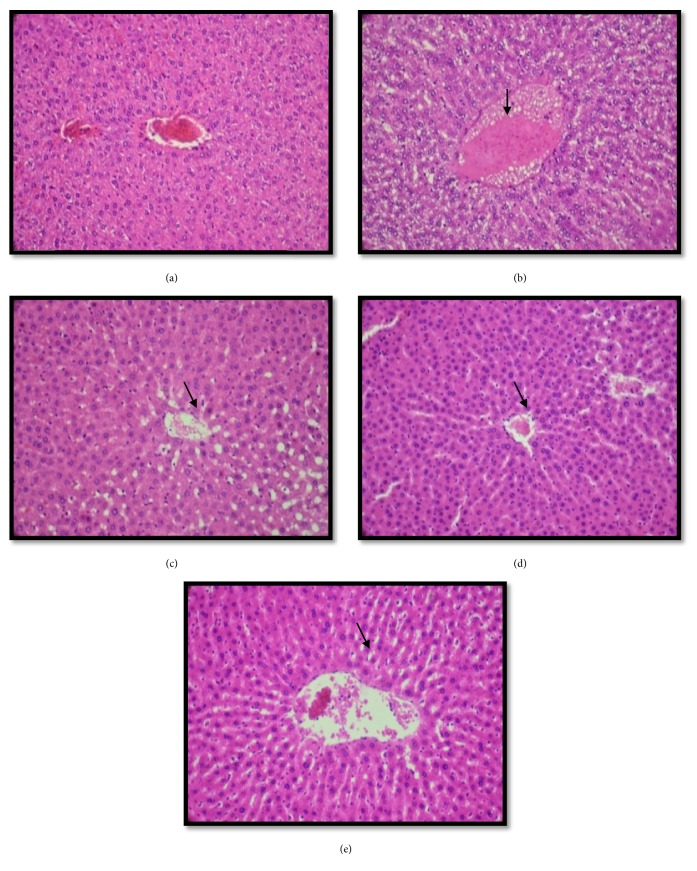
Figure 5.
Histopathological examination of liver in experimental groups of rats. (a) represents a normal hepatic lobules of the control groups; (b) represents histopathological investigation of liver tissue in rats fed on HFD groups which showed severe macrovascular fatty changes distributed throughout the liver lobules; (c and d) represent HFD+ EEA (200- 400mg/kg/bw) groups, which showed a reduction in accumulation of fatty throughout the liver lobules; (e) represents HFD+ ATOR groups in which a potential protective action was shown (H&E × 400).

