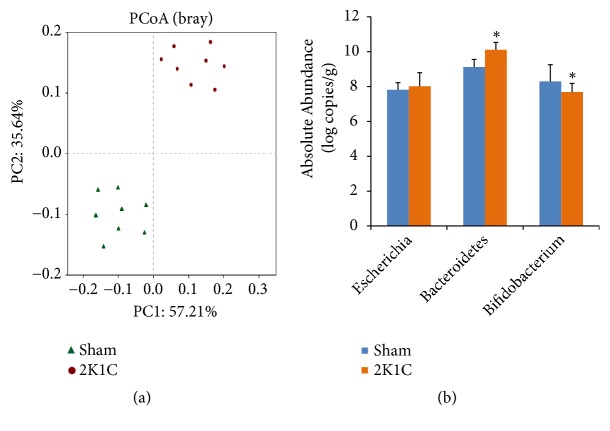
Figure 3.
Compositional and structural shifts of gut microbiota in 2K1C rats (n=8) and sham rats (n=8) fecal samples. (a) PCoA analysis of gut microbiota from 2K1C rats and sham rats. (b) Quantitative PCR analysis of three representative bacteria. Values are expressed as the means ± SE. ∗P<0.05 vs sham group.

