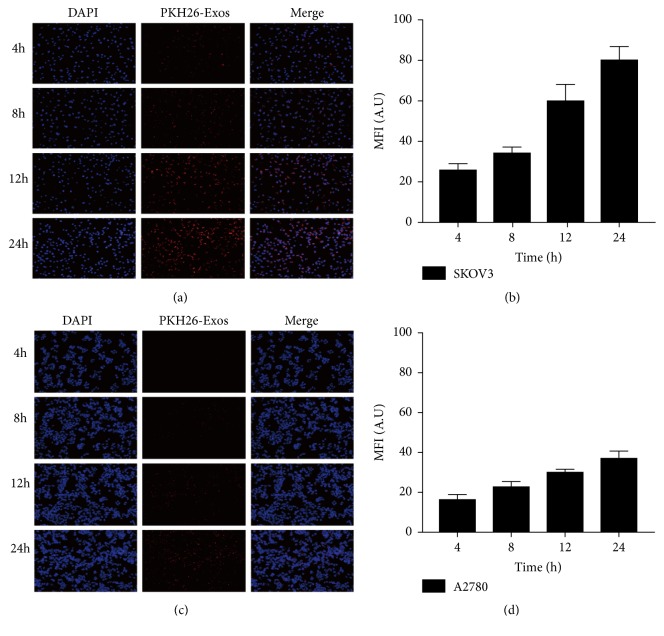
Figure 2.
(a, c) Fluorescence microscopy images of exosomes labeled with PKH-26 after incubation with SKOV3 and A2780 cells for 4, 8, 12, or 24 h. Original magnification, 200×. (b, d) Fluorescence intensity statistical analytical diagram of panels (a) and (c). Data are presented as mean ± SD (n = 3).

