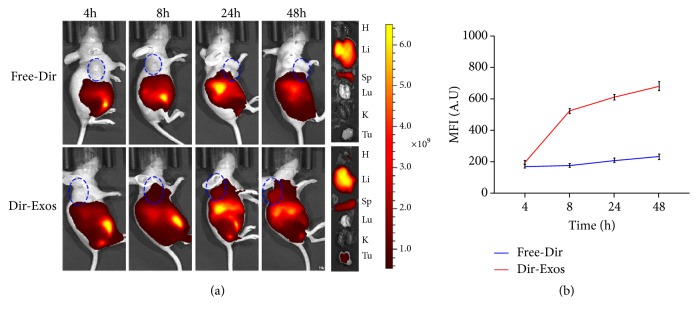
Figure 6.
(a): Fluorescent images of SKOV3-tumor-bearing mice at 4, 8, 24, and 48 h postinjection of Free-Dir and Dir-Exos and fluorescent images of major organs (H: heart; Li: liver; Sp: spleen; Lu: lung; K: kidney; Tu: tumor). The blue circle is where the tumor is. (b) Statistical diagram of fluorescence intensity in tumor. Data are presented as mean ± SD (n =3).

