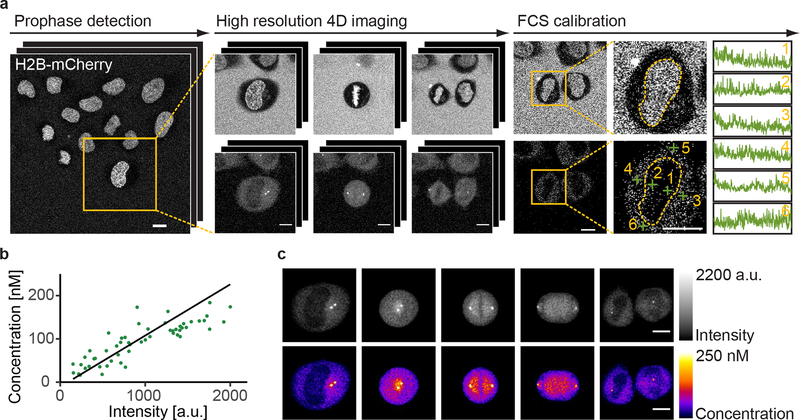
Figure 1 |.
Quantitative imaging of mitotic proteins. (a) Automatic calibrated 3D live confocal imaging pipeline. Cells in prophase were identified by online classification, imaged through mitosis in the landmarks and protein of interest channels, and measured by FCS at selected positions. (b) The local protein concentrations determined by FCS fitting linearly correlate with the background subtracted image intensities at the corresponding positions (shown are data acquired on the same day). (c) Example cell showing concentration map resulting from FCS-based intensity calibration (mean z-projection). Scale bar: 10 μm. Data shown in (a)-(c) is for H2B-mCherry mNEDD1-LAP (EGFP) and is representative of n = 92 independent experiments performed with 28 different cell lines.

