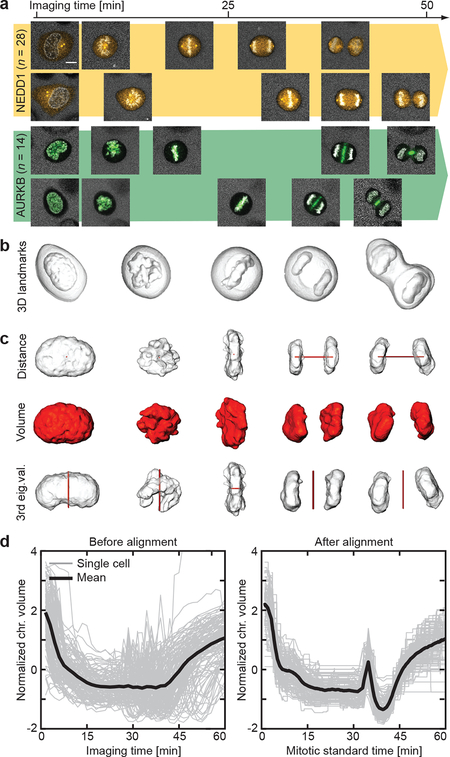
Figure 2 |.
Modeling of mitotic standard time. (a) Individual cells have different mitotic spatio-temporal dynamics. Scale bar: 10 μm. (b) Cellular and chromosomal volumes were segmented from the landmarks channel. (c) Three morphological features (in red) were extracted from the chromosomal volume. (d) Mitotic standard time was generated in the feature space by multiple sequence alignment visualized here in the feature dimension describing chromosomal volume. Shown is the alignment of n = 132 cells from 20 independent experiments.

