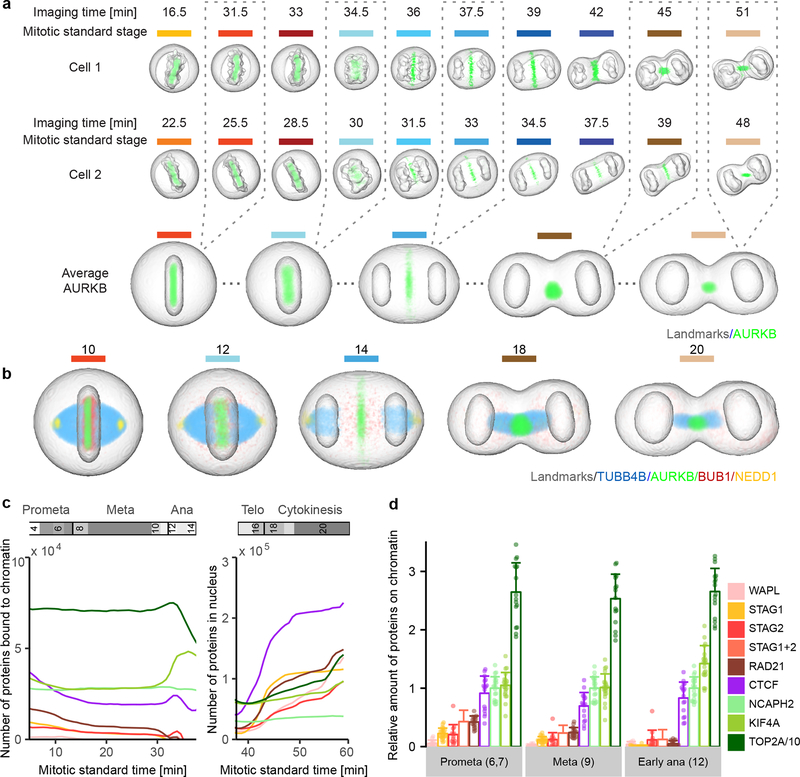
Figure 3 |.
Visualization of 4D protein distribution maps. (a) Through averaging of a large number of cells, models were generated for all mitotic standard stages with symmetrical geometries. Example image sequences were registered to the standard space of the corresponding mitotic standard stage. A distribution map over time was then generated for each protein by averaging through multiple cells. Colored lines indicate mitotic stages. (b) Average distributions of four proteins are displayed in different mitotic stages. (c) Amount of chromatin-bound and nuclear molecules for eight chromatin remodelers. (d) Fraction of chromatin bound proteins relative to NCAPH2. Shown are the single cell values (dots) and the mean and standard deviation. The sum of STAG1 and STAG2 (STAG1+2) was calculated from the mean and standard deviation of STAG1 and STAG2 data. In (c) and (d), TOP2A has been scaled down by a factor 10 for visualization. Note: reported numbers represent monomers, dimers (e.g. TOP2A) would result in a 50% reduced abundance of complexes.

