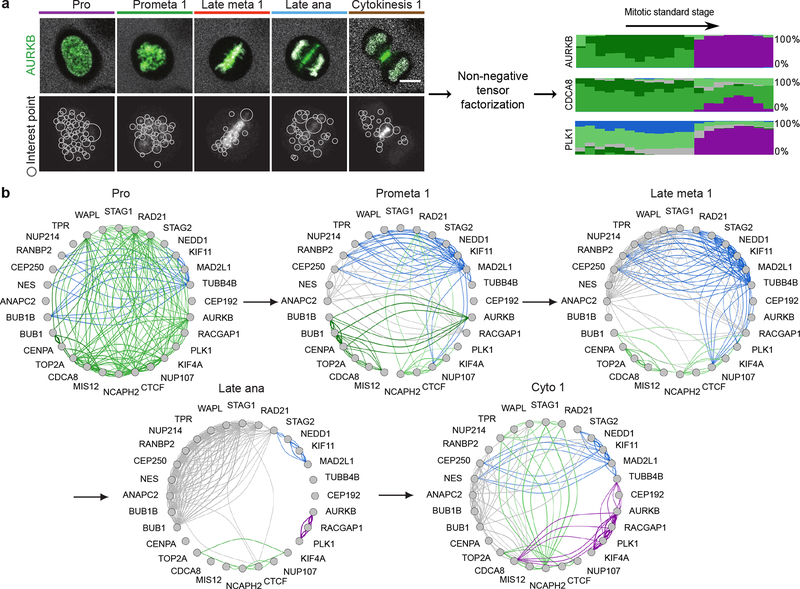
Figure 4 |.
Identification of dynamic protein clusters. (a) SURF interest points were detected and assigned to one of 100 clusters of similar interest points. Non-negative factorization of the data tensor of 28 proteins × features × mitotic stages produced a non-negative tensor of reduced dimension whose entries can be interpreted as the fraction of protein belonging to each cluster over time (right panel, each cluster is represented by a different colour and the height of a coloured bar at a given mitotic stage represents the fraction of the protein in the corresponding cluster at this stage). Scale bar: 10 μm. (b) Dynamic multi-graph of protein co-localization, shown for 5 stages. Each edge colour corresponds to a localization cluster as in (a) and the edge thickness corresponds to the product of the linked genes fractions in the corresponding cluster and can be loosely interpreted as a probability of interactions.

