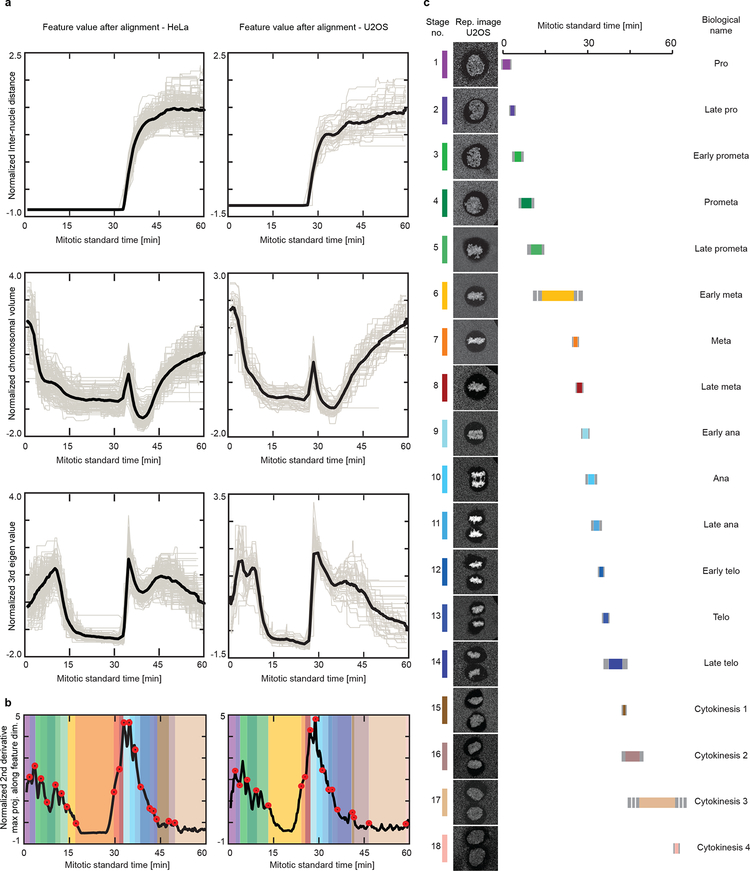
Extended Data Fig. 3 |.
Comparison between mitotic standard time for HeLa Kyoto and U2OS cells. (a) Features used for generating the mitotic standard time model after alignment for HeLa Kyoto cells (left column) and U2OS cells (right column). Grey line: normalized feature value over time of individual cells. Black line: average. (b) Mitotic standard time transitions for HeLa cells (left panel) and U2OS cells (right panel). (c) Standard mitotic U2OS cell represented by the cell closest to the average of each mitotic standard stage. Each mitotic stage was assigned duration (colored line), its duration standard deviation (grey line) and a biological annotation.

