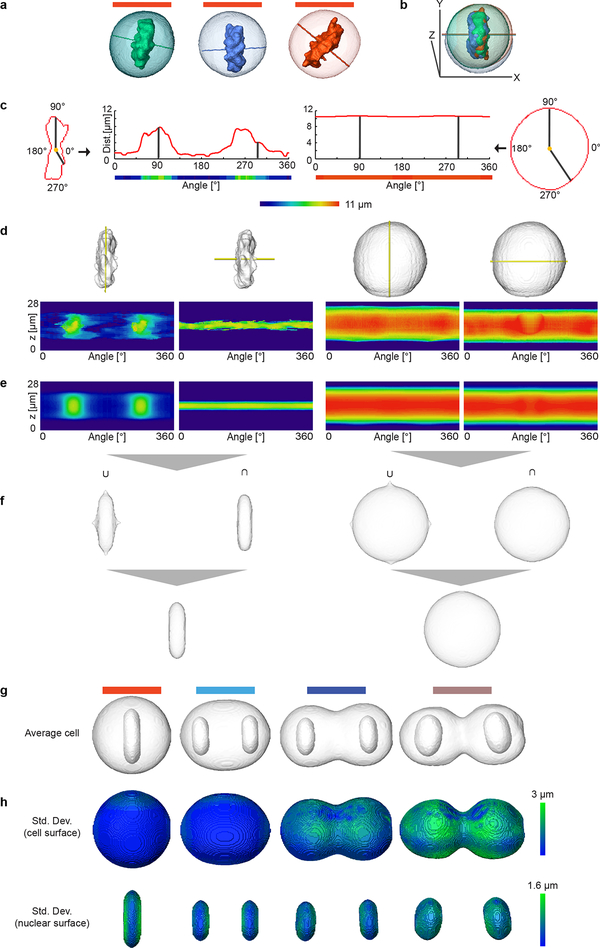
Extended Data Fig. 4 |.
Generation of spatial model for standard mitotic stages by combining two cylindrical representations. Examples of cells in mitotic stage no. 10 (a) were registered using the predicted cell division axis as shown in (b). (c) Transformation between Cartesian and cylindrical coordinate systems. (d) Example cellular and chromosomal surfaces (grey) were transformed into the cylindrical coordinate system using two cylindrical axes (z-axis or predicted division axis) marked in yellow. (e) Average cellular and chromosomal surfaces in cylindrical coordinate systems. (f) Union (U) and intersection (∩) of the averaged landmarks volumes represented in the Cartesian coordinate system that were then combined to generate final cellular and chromosomal surfaces shown in the first image in (g). By averaging a large number of cells, models were generated for all mitotic standard stages with symmetrical geometries and example stages 10, 14, 16 and 19 are shown in (g). (h) The spatial variation of the mitotic standard spaces shown in (g).

