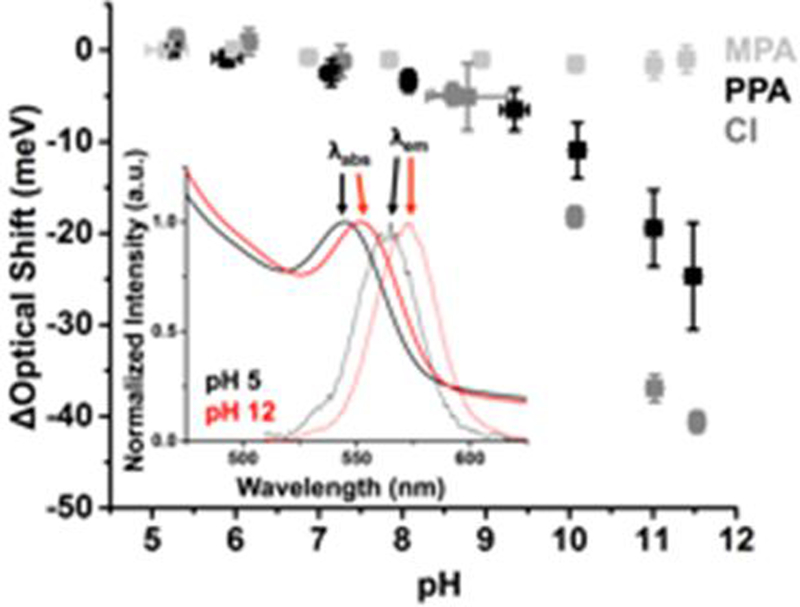
Figure 1.

Shift of the excitonic energies of 0.7 μM CdSe QDs with 300 equivalents of MPA (light gray), 0.6 μM CdSe QDs with 300 equivalents of PPA (black) (see inset), or 0.6 μM CdSe QDs with 150 equivalents of HCl (dark gray) as a function of pH. Each data point is the the average of the shifts of the absorbance (λabs) and emission (λem) peaks within the optical spectra of at least three separately prepared samples of the QDs. The HCl-capped QDs were non-emissive (ESI†), so data for those samples is collected only from absorbance spectra. The data at each pH value is from a separate sample.
