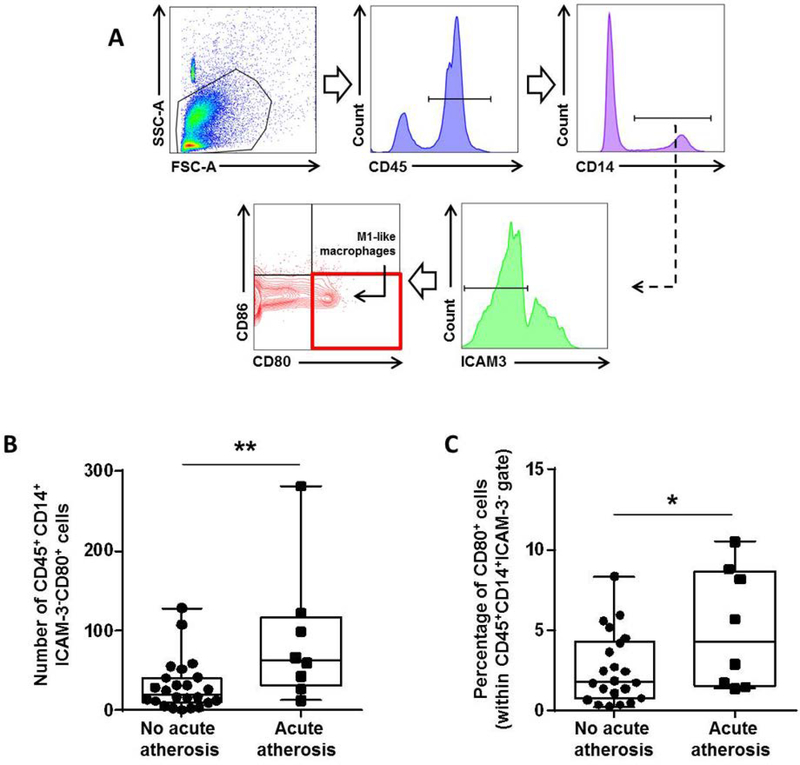
Figure 2. Acute atherosis is characterized by an increase in M1-like decidual macrophages.
(A) Flow cytometry gating strategy used to identify decidual M1-like macrophages (CD45+CD14+ICAM-3-CD80+ cells). Dot plots illustrate the (B) number and (C) proportion of M1-like macrophages in the decidua basalis with or without acute atherosis. Mid-lines indicate medians, boxes indicate interquartile ranges, and whiskers indicate min-max range. Cases with (n=8) or without (n=24) acute atherosis. *p<0.05, **p≤0.01

