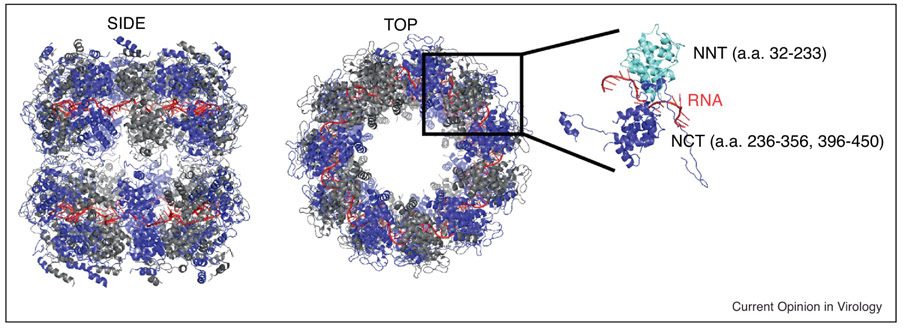
Figure 4:
Structural representation of the ribonucleoprotein complex (PDB 2GTT) with both side (left) and top (center) views. Individual nucleoprotein (N) protomers are depicted as alternating blue and grey with RNA as a red coil. The far right represents a single N protomer with the n-terminal residues (NNT) in cyan and the c-terminal residues (NCT) in blue. [127, 137]

