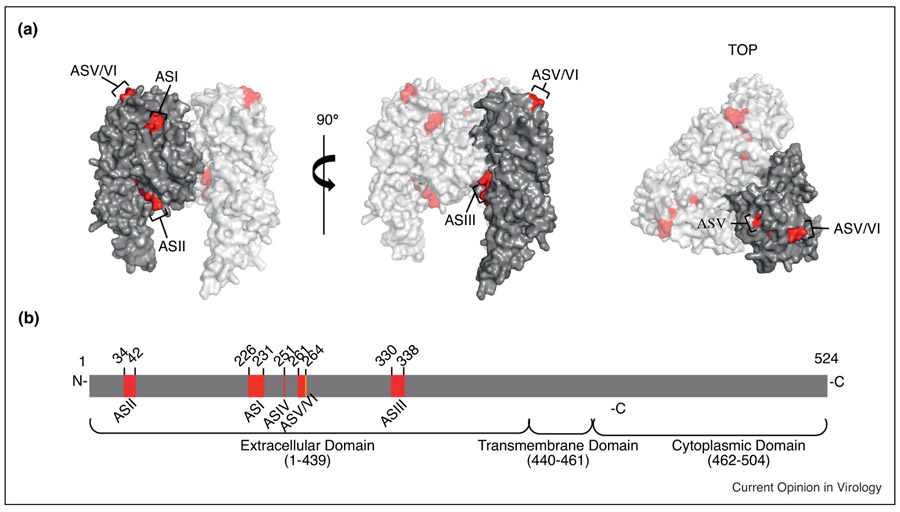
Figure 5:
Schematic representation of the RABV glycoprotein (G) antigenic sites (AS). A) Side view (left) and 90° turn (center) and top view (right) of homology model of RABV G based on VSV G (PDB 2J6J). Residues of AS are highlighted in red for each view. B) Linear schematic showing relative position and amino acid numbering for ASI-VI within the extracellular domain of G. [129, 157, 191, 195].

