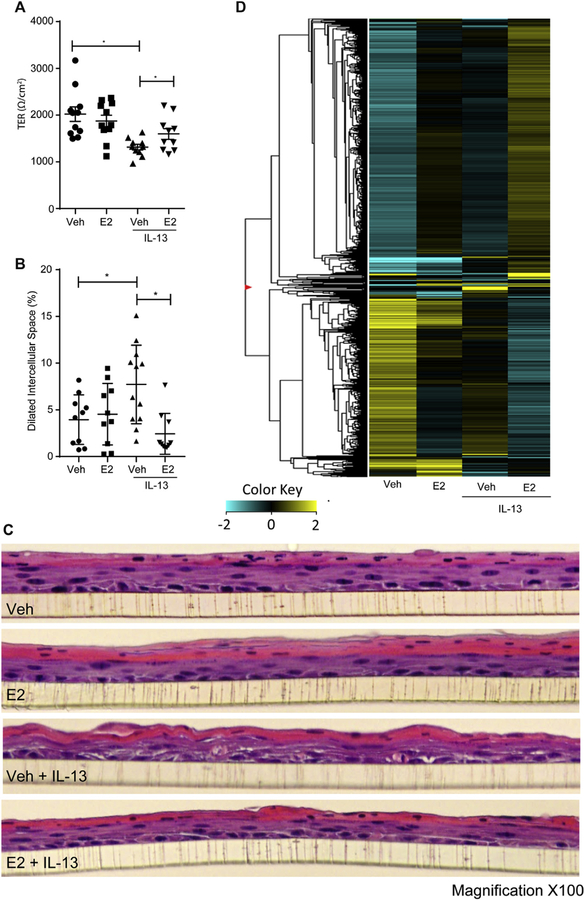
FIG 3.
TER and cellular architecture of esophageal epithelial cells exposed to IL-13 with or without E2. A, TER of the vehicle (Veh)– or E2-pretreated EPC2-ALI monolayer after IL-13 exposure. B and C, Quantification of DISs (Fig 3, B) and representative hematoxylin and eosin staining (Fig 3, C) of EPC2-ALI multicell layer cultures of the vehicle- or E2-pretreated EPC2-ALI monolayer after IL-13 exposure. D, RNA-seq expression analysis represented by RPKM values of esophageal epithelial cells (EPC2-ALI) exposed to vehicle or IL-13 with or without E2. Upregulated genes are represented in yellow, and downregulated genes are represented in blue. Magnitude of expression is represented by darkness of the color. EPC2-ALI monolayers were pretreated with vehicle (0.01% EtOH) or E2 (100 nmol/L) for 24 hours and subsequently stimulated with vehicle (PBS) or IL-13 (100 ng/mL) in the presence of E2 for 24 hours, and TER measurements were performed by using an 8-chamber EasyMount Ussing Chamber System, as described in the Methods section. C, DIS formation (percentage of total area) was quantitated by using morphometric analyses and expressed as means ± SEMs (n = 3 independent experiments). *P < .05. Fig 3, C, Magnification ×100.

