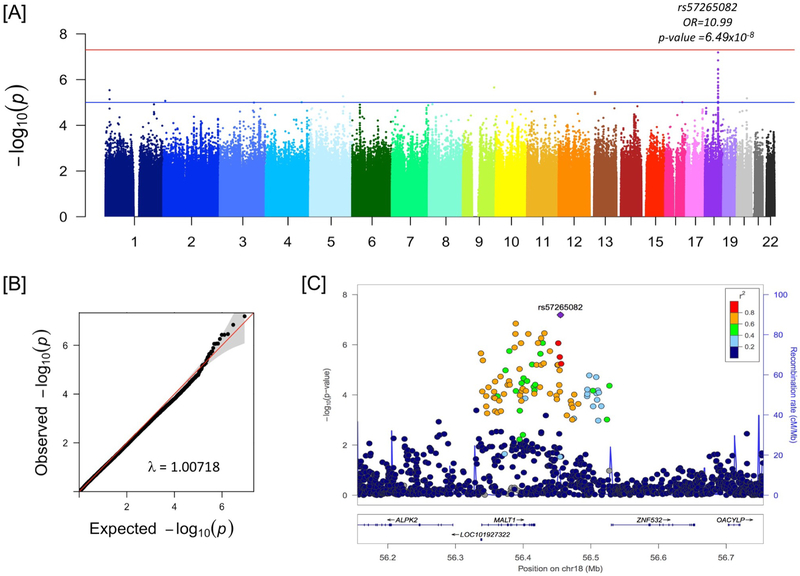
Figure 1:
Genome-wide association with peanut allergy at 60 months in N=275 LEAP participants in the peanut avoidance group. Panel A is the genome-wide Manhattan plot for N=4,444,069 SNVs with MAF ≥ 2%, missingness < 5%, and Hardy-Weinberg Equilibrium p ≥ 10−6. Panel B is the quantile-quantile plot of the same data as Panel A. Panel C shows the peak association region on chromosome 18.

