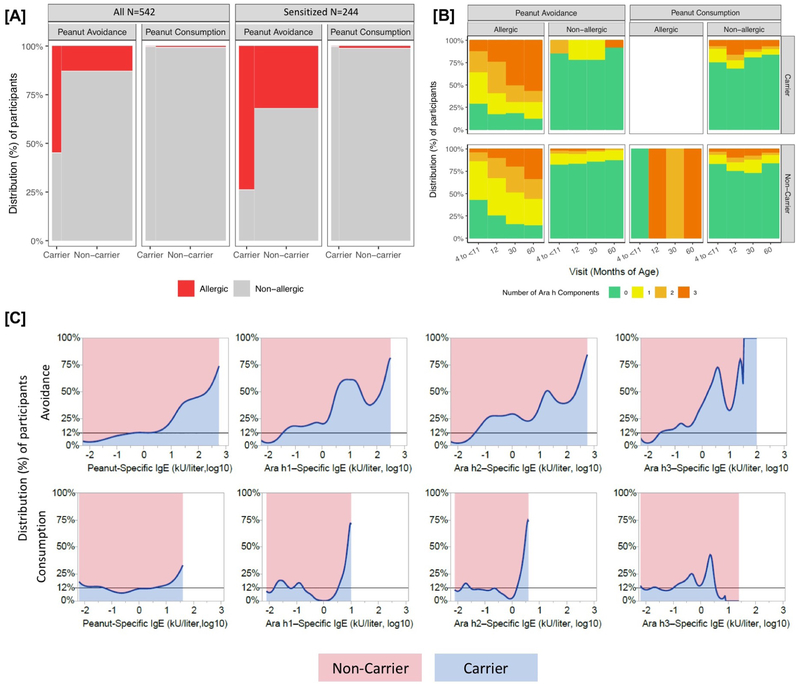
Figure 2:
Panel A shows the proportion of allergic and non-allergic LEAP participants at 60 months of age by treatment group and MALT1 carrier status in all LEAP participants (left) and the sensitized group (right, defined as those with peanut-specific IgE ≥ 0.1 kU/liter at 60 months). Panel B shows the IgE response to Ara h1, Ara h2, and Ara h3 over the course of the LEAP study in all participants (N=542). Ara h status was imputed to 0 for all participants with peanut-specific IgE <0.1. Panel C is the proportion density plots showing the relative distribution of peanut-specific IgE and IgE to Ara h1, Ara h2, and Ara h3 between the MALT1 Carrier and Non-carrier groups at 60 months of age. The horizontal reference line at 12% indicates the proportion of the population with at least one MALT1 risk allele, which illustrates a null distribution with equal proportions of individuals at all titer levels between the carriers and non-carriers. Ara h status was imputed to −2 (log10) for all participants with peanut-specific IgE <0.1 kU/liter. For all panels, imputed genotypes were used for 7 individuals missing allele calls at rs57265082, and Non-carriers were defined as having at least one copy of the T allele (due to the low MAF).

