
Figure 3. The BOLD signal in response to OG stimuli in a fully awake mouse.
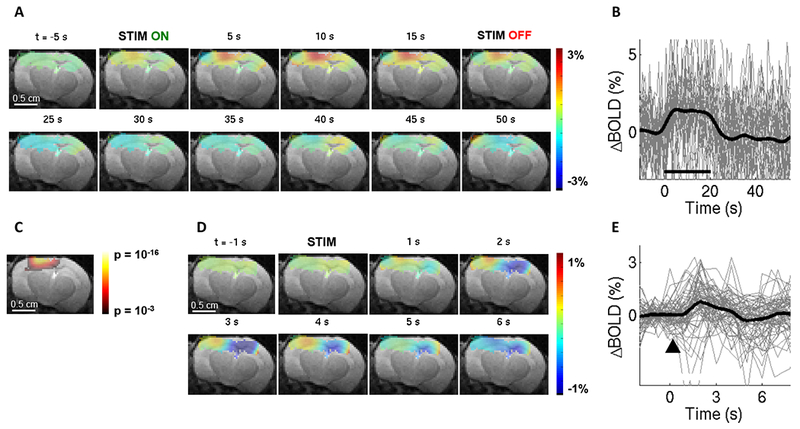
A. Spatiotemporal evolution of the BOLD signal change from a single slice cutting through the center of the evoked response, presented as trial-averaged ratio maps, in response to a 20-s train of 100-ms light pulses delivered at 1 Hz (“blocked” OG stimulus) in a single Emx1-Cre/Ai32 subject. EPI images were thresholded to reflect the sensitivity of the surface RF coil (for display purposes only). The ratio images are overlaid on the structural (TurboRARE) image of the same slice.
B. BOLD response time-courses extracted from the active ROI. 28 stimulus trials are superimposed. The average is overlaid in thick black. For the full range of the y-axis, see Supplementary Fig. S3.
C. Thresholded (p = 0.001 uncorrected) statistical p-map corresponding to the data shown in (A) assuming the standard hemodynamic response function (HRF) with temporal derivatives (see Mehods). This map was used to define the ROI for extraction of time-courses in (B) and (E).
D. As in (A) for single 100-ms light pulses (“event-related” OG stimulus) in the same subject.
E. BOLD response time-courses corresponding to (D). 69 stimulus trials are superimposed. The average is overlaid in thick black.