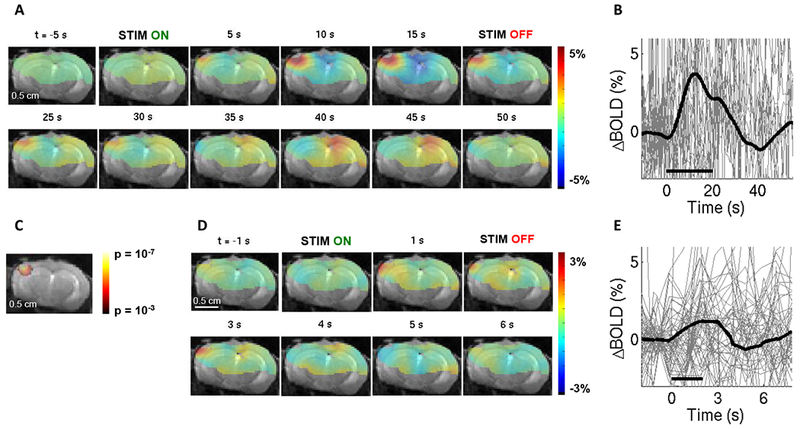
Figure 4. The BOLD signal in response to sensory stimuli in a fully awake mouse.

Conventions are the same as in Fig. 3. (A)-(C) correspond to 20-s stimulus duration (n=21 trials). (D)-(E) correspond to 2-s stimulus duration (n=57 trials). For the full range of the y-axis for the BOLD signal time-courses, see Supplementary Fig. S3.
