Figure 11.

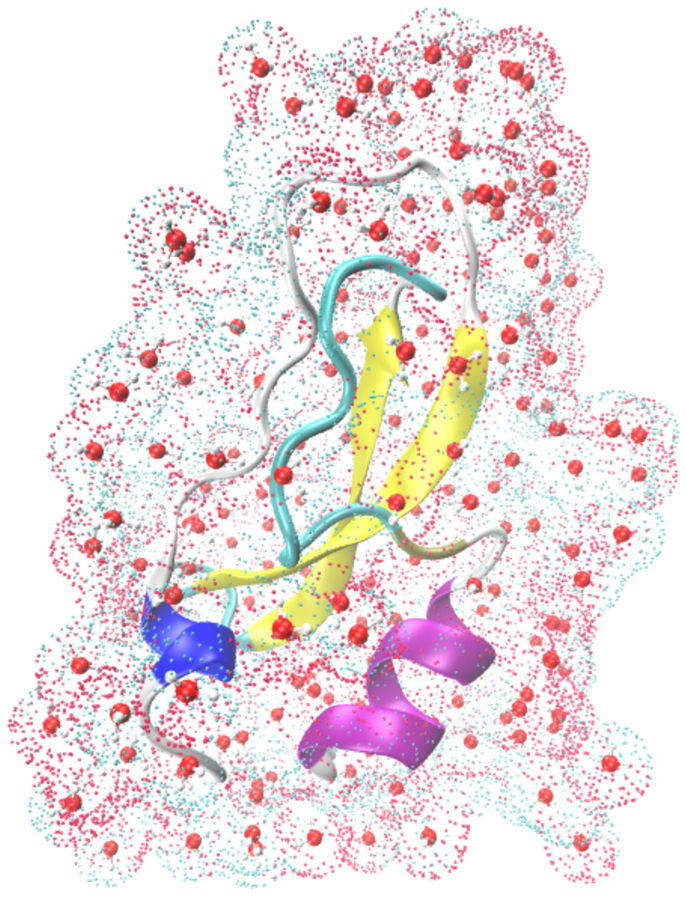
Graphical representation of a small protein (PDB entry: 1LD5) together with the first solvation shells and surface charges calculated by DivCon program (colored dots represent the surface charges).

Graphical representation of a small protein (PDB entry: 1LD5) together with the first solvation shells and surface charges calculated by DivCon program (colored dots represent the surface charges).