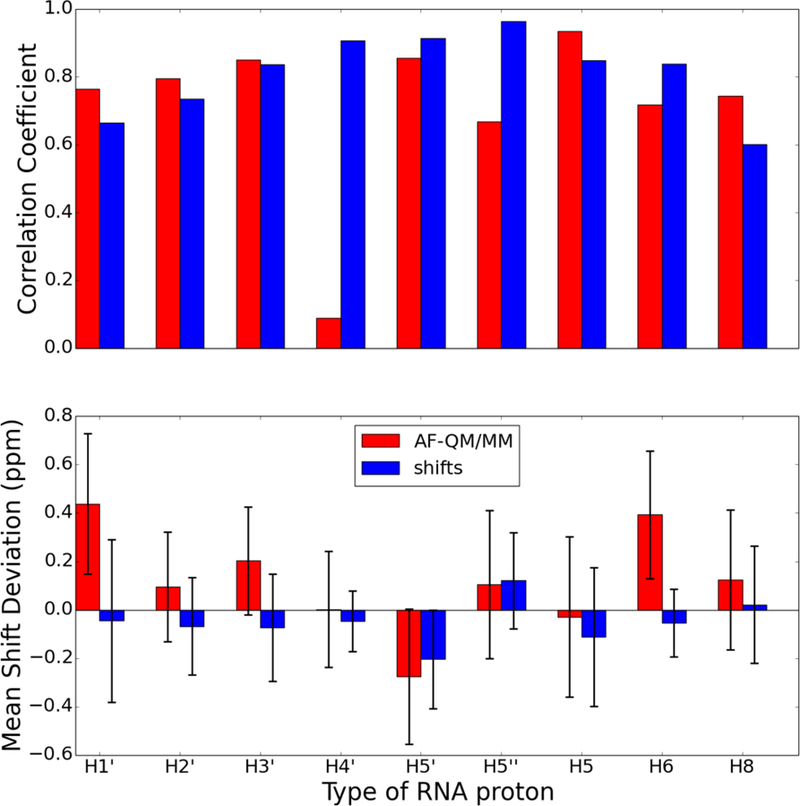
Figure 16.

Comparison of proton chemical shifts for all protons in the UUCG RNA hairpin (PDB id 2KOC) predicted using the AF-QM/MM model and shifts classical model. The chart on top shows the correlation coefficient, R, between the predicted and observed chemical shifts. The chart on bottom shows the average signed chemical shift deviation compared to experiment with the error bars indicating the standard deviation of the computed errors. The proton types correspond to the PDB naming convention (e.g., H1’ is the proton attached to C1’ of the ribose).
