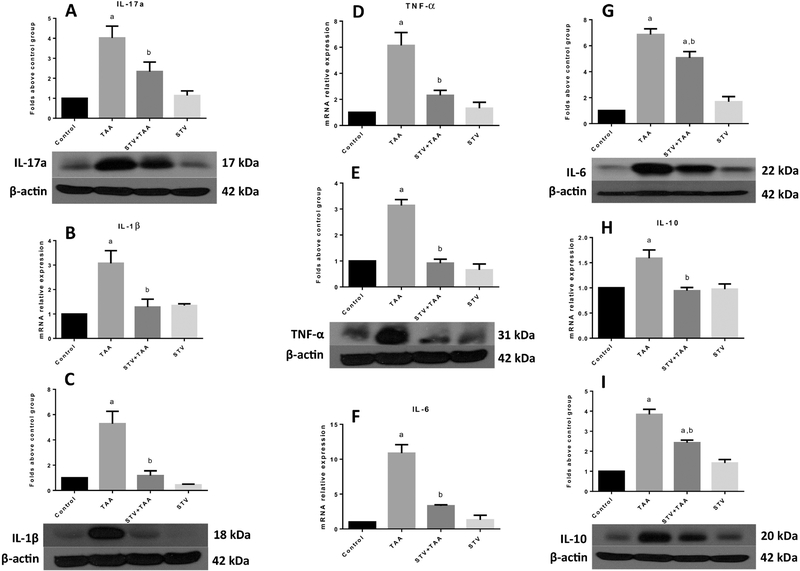
Figure 4. Stevioside (STV) prevents the production of proinflammatory cytokines in thioacetamide (TAA)-induced cirrhosis.
Protein levels of IL-17a (A), mRNA and protein level increase of IL-1β (B, C), TNF-α (D, E), IL-6 (F, G) and IL-10 (H, I) are shown. β-Actin was used as a control. The values are expressed as the fold increase of optical densitometry normalized to the control group values (control = 1). Each bar represents the mean value of experiments conducted in duplicate assays ± SEM (n = 3). ap < 0.05 vs control. bp < 0.05 vs TAA.

