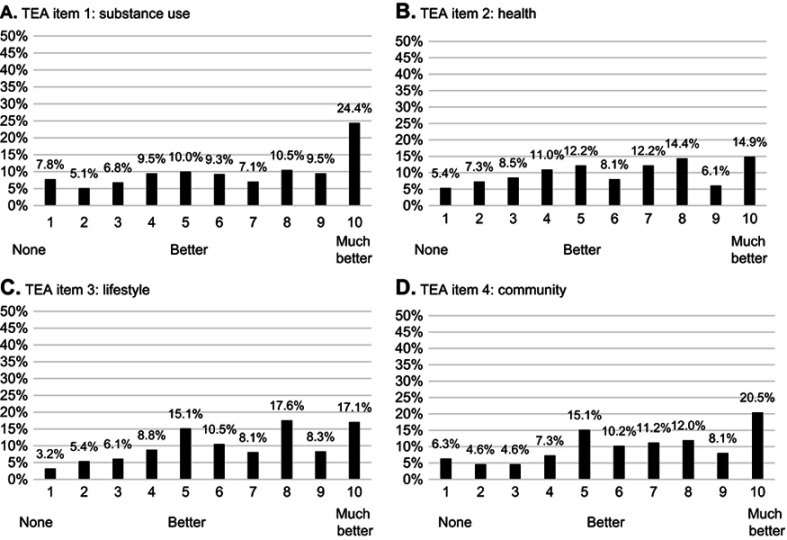
Figure 1.
Item distribution and floor-ceiling effects at baselinea. (A) TEA Item 1: substance use. (B) TEA Item 2: health. (C) TEA Item 3: lifestyle. (D) TEA Item 4: community.
Note: aGiven that there are ten response options for each item, an item may be subject to a floor or ceiling effect if more than 10% (=100/the number of response options) of responses are in the highest or lowest response categories.
Abbreviation: TEA, Treatment Effectiveness Assessment.

