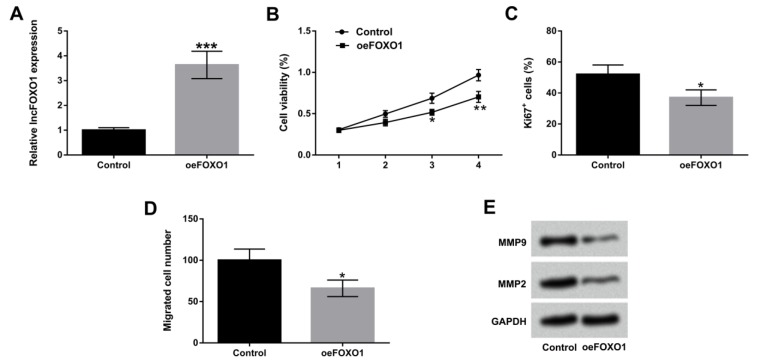
Figure 3.
Overexpression of lncFOXO1 suppressed cell proliferation and migration. A549 cells were transfected with pc-FOXO1 vector. (A) The expression level of lncFOXO1 in control and pc-FOXO1 transfected cells was examined by qRT-PCR; (B) The cell viability in control and pc-FOXO1 transfected cells was detected by MTT assay; (C) The percentage of Ki67+ cells in control and pc-FOXO1 transfected cells was detected by flow cytometry assay; (D) The migration of A549 cells in control and pc-FOXO1 transfected cells was determined by Transwell assay; (E) The protein levels of MMP9 and MMP2 in control and pc-FOXO1 transfected cells were assessed by western blot. Data are presented as the mean ± SD of three independent experiments. * P<0.05, ** P<0.01, *** P<0.001
LncFOXO1: long non-coding RNA FOXO1; shRNA: short hairpin RNA; qRT-PCR: quantitative real time PCR; MTT: 3-(4, 5-dimethylthiazol-2-yl)-2 5-diphenyl-2Htetrazolium bromide; MMP: matrix metallopeptidase

