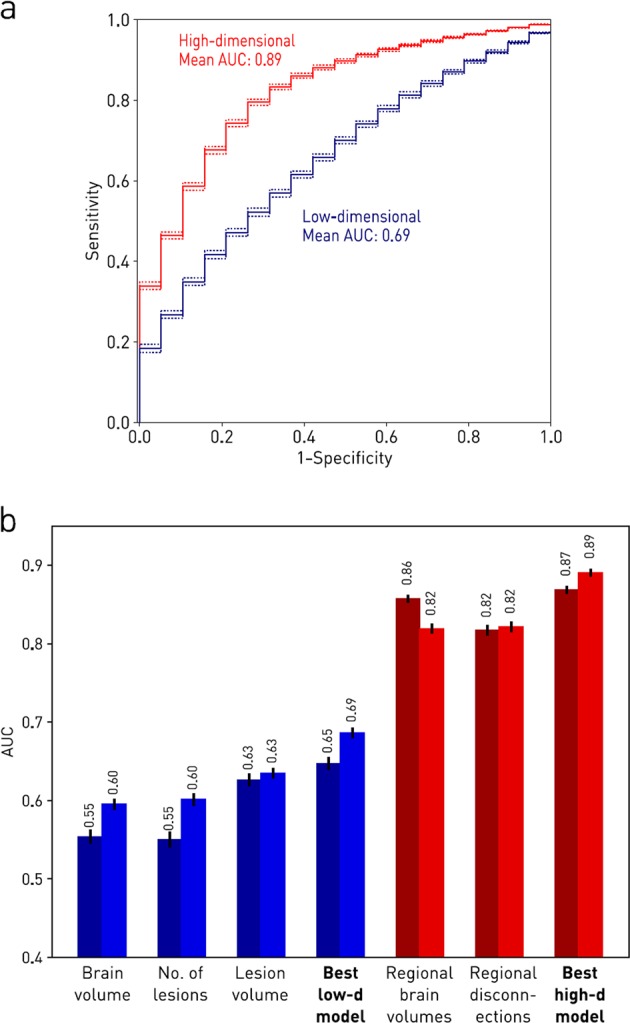
Fig. 1.

Imaging response detection with low- and high-dimensional models. a Receiver operating characteristic curves for imaging response detection using the best high- and low-dimensional models. Solid lines indicate the mean performance of each model, and dashed lines the 95% confidence intervals for the mean. b Imaging response detection performance for each model and the two types of classifier obtained with two different machine learning techniques. Bars indicate the mean performance of each model and the lines the 95% confidence intervals for the mean. Low-dimensional models are drawn in blue, while the high-dimensional models are drawn in red. Darker colour bars indicate the support vector machine classifiers; the lighter colour bars indicate the extremely randomised trees classifiers. All high-dimensional models are seen to outperform the best low-dimensional model, regardless of the classifier used
