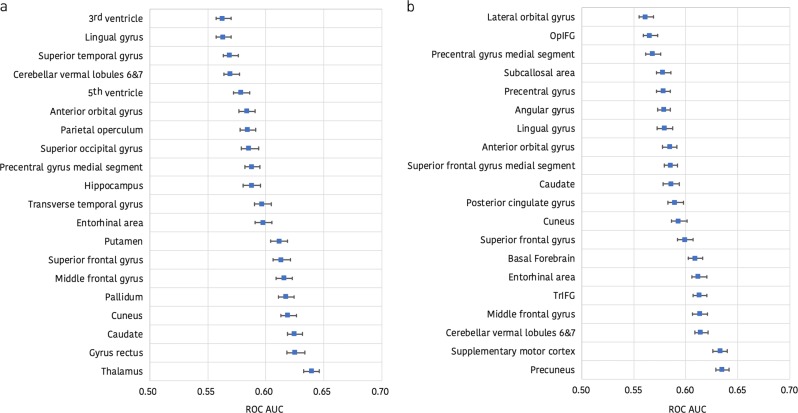
Fig. 2.
Regional brain volume and disconnectome trajectories most relevant to detecting the imaging response to treatment. The horizontal axes show the maximum of the two mean areas under the receiver operating characteristic curve with 95% confidence intervals obtained using the SVM and ERT classifiers when each regional brain volume (a) and each regional disconnectome (b) predictor is used in isolation. The following abbreviations have been used: OpIFG opercular part of the inferior frontal gyrus, TrIFG triangular part of the inferior frontal gyrus

