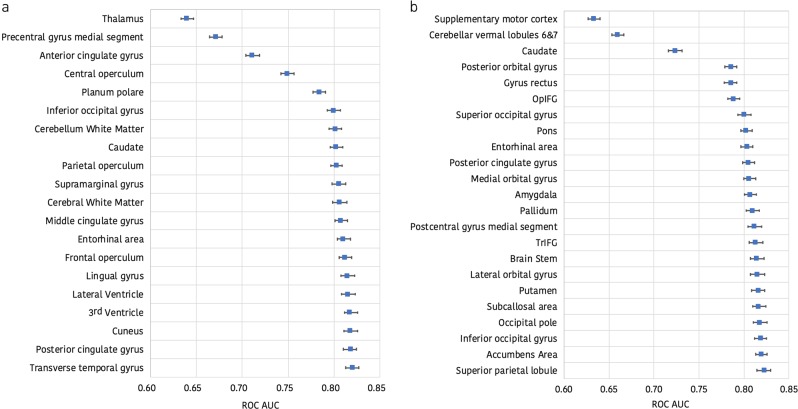
Fig. 3.
Brain regions included in the best high-dimensional ERT model based solely on regional brain volume and disconnectome trajectories. a The horizontal axis shows the mean area under the receiver operating characteristic (ROC) curve with 95% confidence intervals as each regional brain volume predictor is added to the model starting with the thalamus. b The horizontal axis shows the mean area under the ROC curve with 95% confidence intervals as each regional brain disconnectome predictor is added to the model starting with the supplementary motor cortex. OpIFG opercular part of the inferior frontal gyrus, TrIFG triangular part of the inferior frontal gyrus

