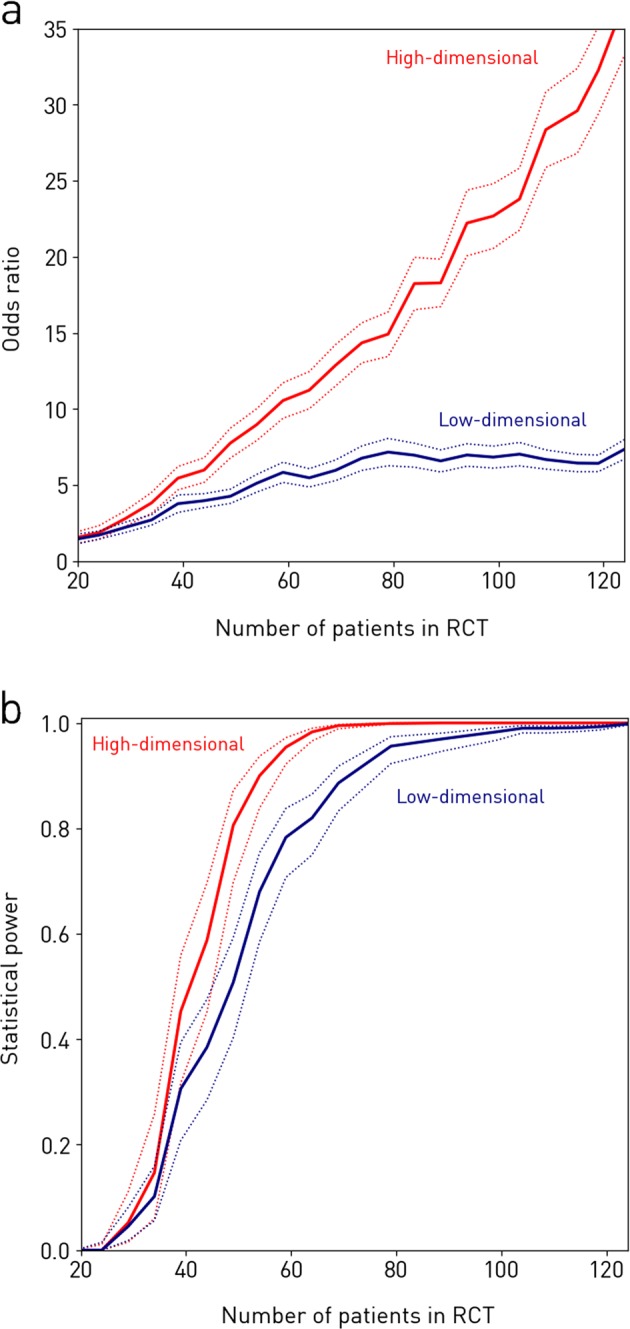
Fig. 5.

Simulated randomised controlled trials (RCT) of the intervention incorporating varying numbers of patients. Each RCT is simulated by randomly choosing a subset of N patients and evaluating the association between classifier output and imaging response with a Fisher’s exact test. The procedure is repeated 500 times, yielding a mean odds ratio (panel a, solid lines), and a mean achieved statistical power given a significance level of α = 0.01 (panel b, solid lines), along with 95% confidence interval (both panels, dotted lines) for each N. RCTs in red use the best performing high-dimensional model to detect the response, while RCTs in blue use the best performing low-dimensional model. a The odds ratio. It is seen that, if one performs an RCT with 124 patients enrolled, the odds ratio is 36.8 if one uses the high-dimensional method vs. only 7.35 if one uses a traditional low-dimensional approach. RCTs using the high-dimensional model not only produce larger odds ratios, but they also scale better with increasing patient numbers. b The achieved statistical power. We see that the statistical power achieved by the high- and low-dimensional models, respectively, are 0.806 [95% CI = 0.698–0.872] and 0.508 [95% CI = 0.403–0.593] with N = 50, at a significance level of α = 0.01. Thus in an RCT with 50 subjects enrolled, the risk of making a type II error is very significant with the traditional low-dimensional approaches, while a statistical power greater than 0.80 can be achieved at the same N with the high-dimensional method
