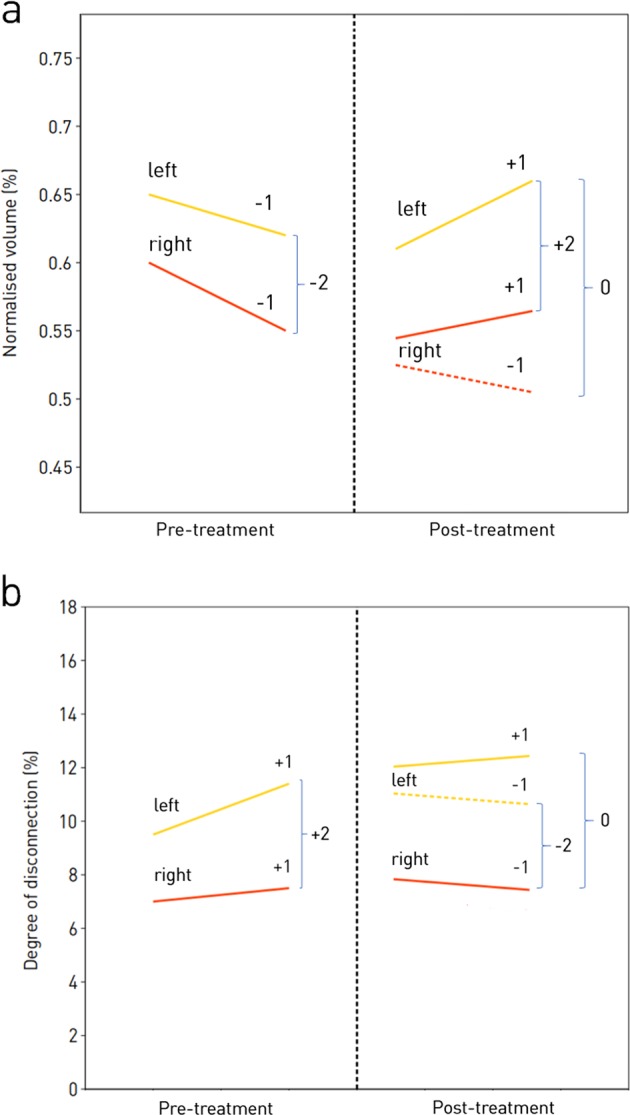
Fig. 7.

Illustration of the slope of an imaging metric between two pre-treatment scans, and the different potential slopes between two subsequent post-treatment scans, showing how these are scored. a In the pre-treatment period the imaging metric, e.g. the normalised volume of the thalamus is decreasing in both the left and the right hemispheres, thus each has a trajectory of −1, leading to a net trajectory of −2. In the post-treatment period, the normalised volume of the left thalamus is increasing, while we illustrate two differential scenarios: one in which the normalised volume of the right thalamus is continuing to decrease, and one which the normalised volume is increasing, leading to net trajectories for the normalised volume of the thalamus of 0, and +2, respectively. b In the pre-treatment period the imaging metric, e.g. the degree of disconnection of the thalamus is increasing in both the left and the right hemispheres, thus each has a trajectory of 1, leading to a net trajectory of +2. In the post-treatment period, the degree of disconnection of the right thalamus is getting smaller, while we illustrate two differential scenarios: one in which the degree of disconnection of the left thalamus is continuing to increase, and one which the degree of disconnection is getting smaller, leading to net trajectories for the degree of disconnection of the thalamus of 0, and −2, respectively
