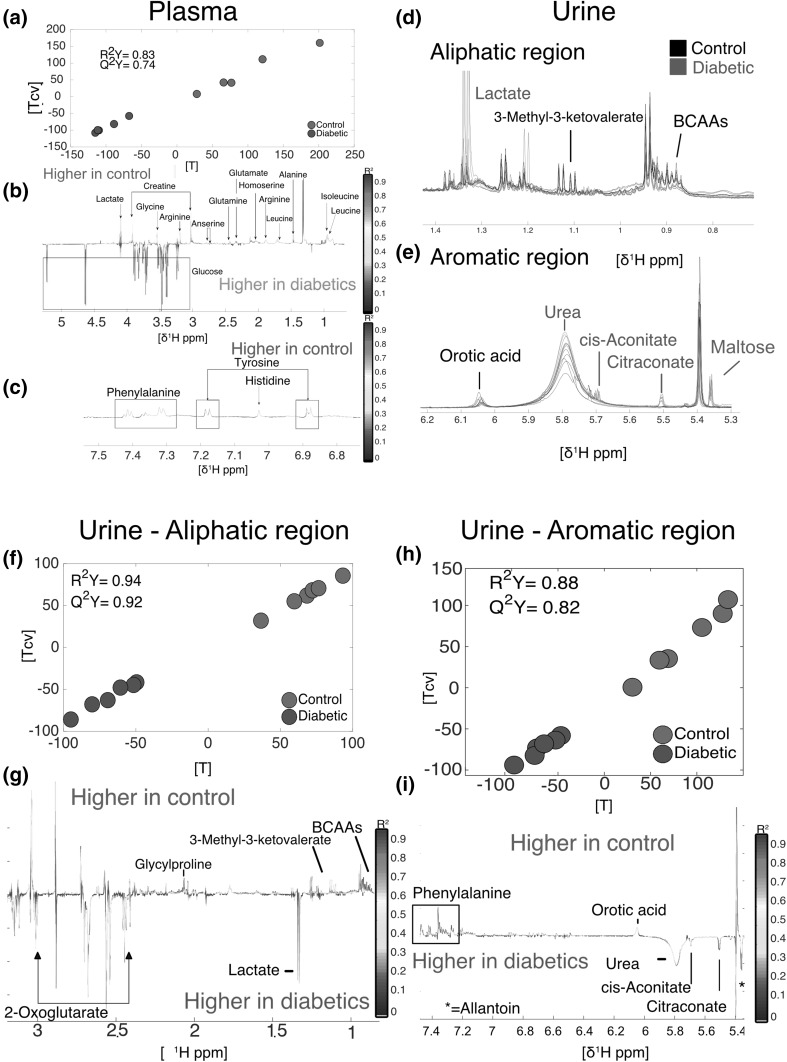
Fig. 1.
Metabolic differences in plasma (a, b and c) and urine (d, e, f, g, h and i). a plasma O-PLS DA model score plot calculated using all spectra as a matrix of independent variables and genetic background as predictor (R2Y = 0.83, Q2Y = 0.74, n = 10). d and e Aliphatic and aromatic regions of urine spectra showing differences between diabetic (red) and control (black) individuals. f and g O-PLS DA model score and loading plots calculated using the aliphatic (R2Y = 0.94, Q2Y = 0.92) region of urine. h and i O-PLS DA model calculated using the aromatic (R2Y = 0.88, Q2Y = 0.82) region of urine

