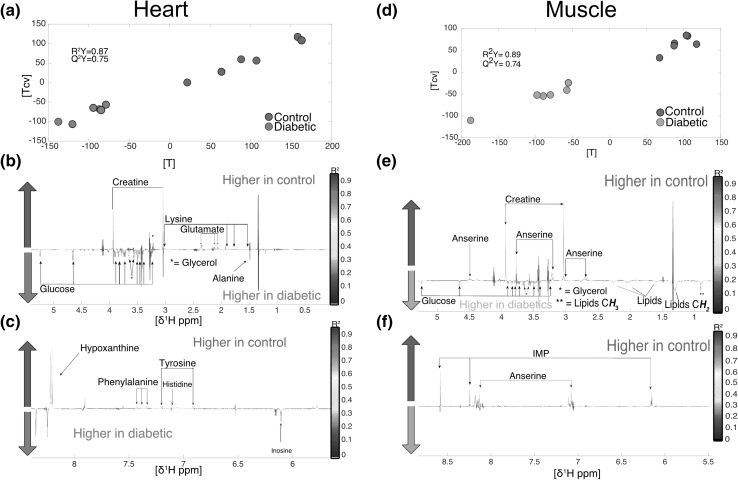
Fig. 2.
Metabolomics differences in heart and muscle. a heart O-PLS DA model (R2Y = 0.87, Q2Y = 0.75) score plot calculated using all spectra as a matrix (n = 12) of independent variables and genetic background as predictor. b and c loading plots from the heart O-PLS DA model. d score plot of the muscle O-PLS DA model calculated using all spectra as a matrix (n = 12) of independent variables and genetic background as predictor (R2Y = 0.89, Q2Y = 0.74). e and f loading plots from the O-PLS DA model carried out in muscle samples

