Fig. 3.
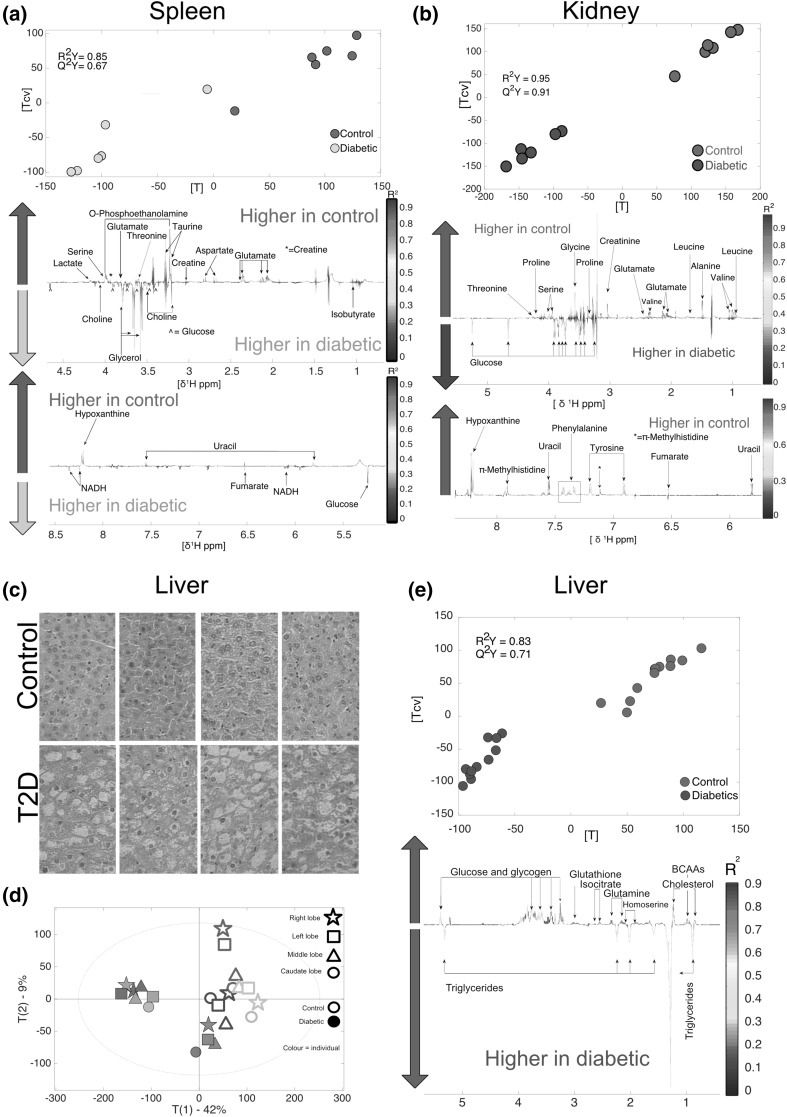
Metabolomics and histological analysis of liver and metabolomics analysis of spleen and kidney. a Liver histology, type 2 diabetes individuals showed clear fat accumulation characteristic of steatosis (lower row) compared to control liver (top row) in all the liver lobes. b PCA showing clusters control and diabetic individuals respectively. Higher variability was observed in healthy individuals. c O-PLS DA model calculated using all liver spectra as a matrix of independent values (R2Y = 0.83 and Q2Y = 0.71). d spleen O-PLS DA model calculated using all spectra as a matrix (n = 12) of independent variables and genetic background as predictor (R2Y = 0.85, Q2Y = 0.67, n = 12). e Kidney O-PLS DA model calculated using all spectra as a matrix (n = 12) of independent variables and genetic background as predictor (R2Y = 0.95, Q2Y = 0.91)

