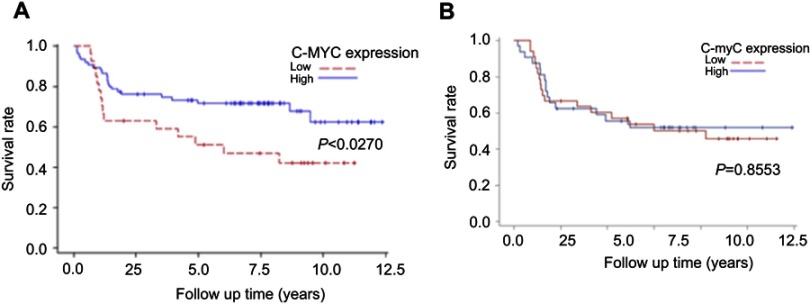
Figure 2.
(A) Kaplan–Meier survival curves associated with c-MYC expression among oral cancer patients in T III/IV stage. P-values obtained from log-rank tests for the homogeneity of Kaplan–Meier curves between high and low c-MYC expressions was 0.0270. (B) Kaplan–Meier survival curves associated with c-myC expression among oral cancer patients in AJCC III/IV stage. P-values obtained from log-rank tests for the homogeneity of Kaplan–Meier curves between high and low c-myC expressions was 0.8553.

