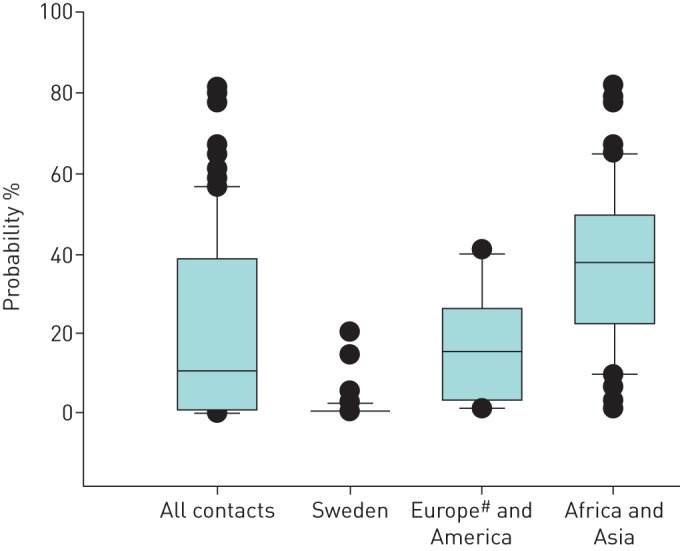
FIGURE 2.

Probability of remote latent tuberculosis infection in contacts of pulmonary tuberculosis cases according to their regional origin. Horizontal lines represent median values, boxes represent interquartile ranges, whiskers represent the 10th and 90th percentiles, and circles represent outliers. #: excluding contacts originating from Sweden.
