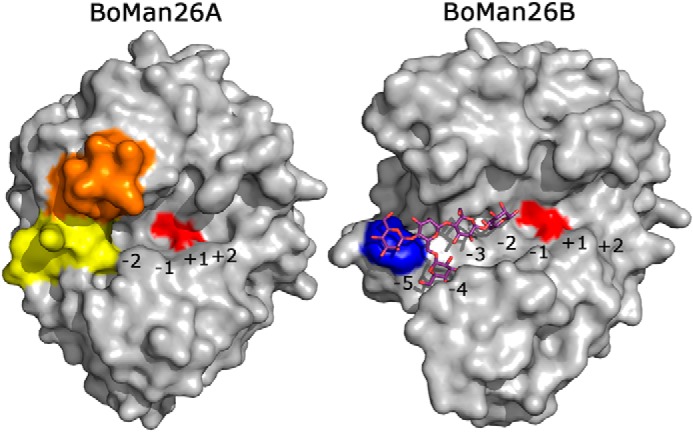
Figure 7.

Surface overviews of BoMan26A (11) and BoMan26B. The G1M4 oligosaccharide bound in BoMan26B is shown in stick representation. The subsites in each enzyme have been marked. The catalytic residues are shown in red; Trp-112 in BoMan26B is shown in blue, and in BoMan26A, the two significant loops (11) are colored: loop 2 (yellow) and loop 8 (orange).
