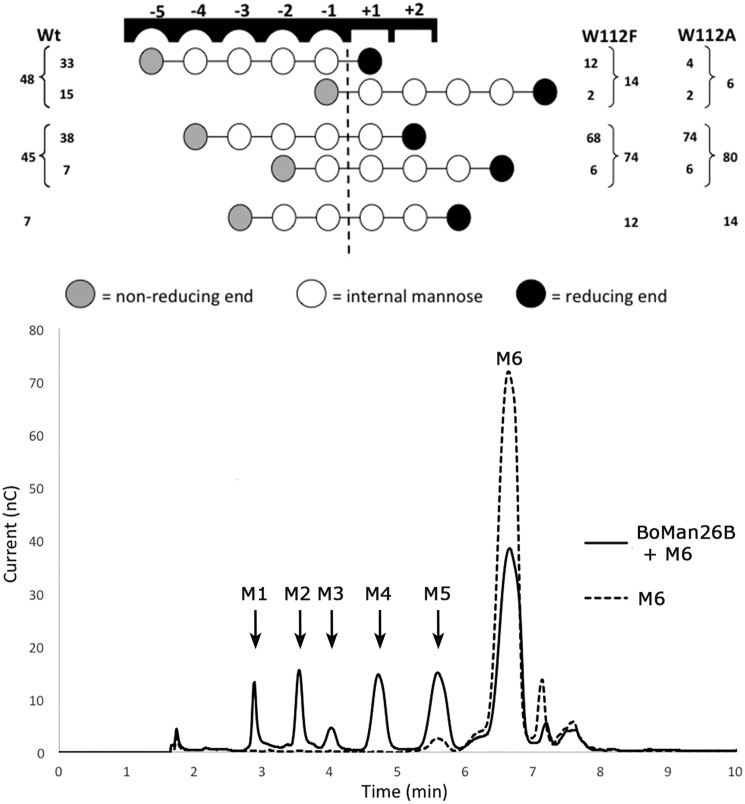
Figure 8.
Productive M6-binding modes for BoMan26B (Wt) and two subsite −5 variants. Top: 18O data showing the relative frequency (%) between different preferred productive binding modes of M6 for the Wt BoMan26B and the variants W112A and W112F. Each circle represents a mannose unit with the dashed line between the −1 and +1 subsites showing the point of hydrolytic cleavage. HPAEC data were used to determine the relative frequency of oligosaccharides produced (outer frequency numbers), which was followed by determination of the ratios of 18O-labeled versus nonlabeled M5, M4, or M3 (MALDI-TOF MS) to determine the frequencies of modes giving the same products (inner frequency numbers). The mannose unit, which is present at the −1 subsite of each hydrolytic event, will be labeled with 18O upon incubation in 18O-labeled water. MALDI-TOF MS analysis thus can be used to determine the ratio of e.g. labeled M4 versus unlabeled, and these data were used to calculate the inner frequency numbers. Bottom: early to intermediate hydrolysis profile of BoMan26B (Wt) on M6 is analyzed by HPAEC-PAD.

