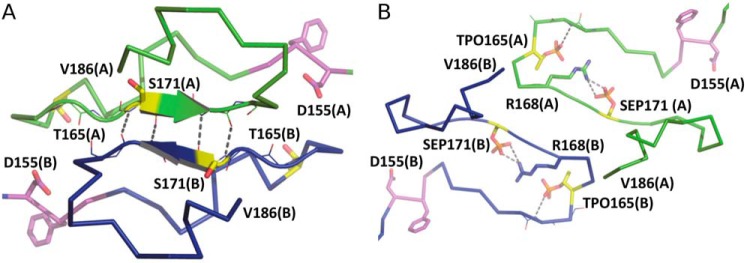
Figure 2.
Activation loops of the HPK1+0P and HPK1+2P dimers. A, the activation loops of the +0P dimer in ribbon representation with chain A in green and chain B in blue. Arrows show areas of β-strand. The DFG motif and phosphorylation sites are drawn as magenta and yellow sticks, respectively. Dashed lines indicate hydrogen bonds. B, the activation loops of the +2P dimer. The coloring scheme is as described in A. Dashed lines show interactions between protein and phosphate groups.

