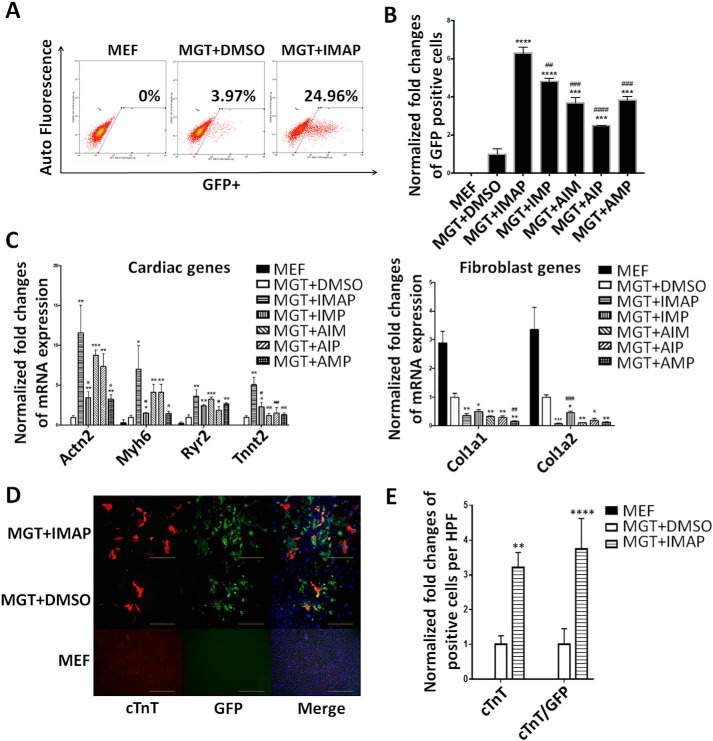
Figure 2.
IMAP enhanced cardiac reprogramming of MEFs. A, representative FACS plots showing MEFs (control) and iCMs with α-MHC–GFP+ cells after 2 weeks of reprogramming with IMAP or DMSO treatment. B, bar graph showing normalized -fold changes of α-MHC–GFP+ cells 2 weeks after GMT infection with indicated chemical treatment. C, bar graph representing major cardiac and fibroblast genes as determined by qPCR in cells after 2 weeks of reprogramming and indicated chemical treatment. D and E, representative images of immunofluorescence staining (D) and quantification of (E) cardiac markers α-MHC–GFP (green), cTnT (red), and double positive cells in fibroblasts (control) or cells treated with either MGT+DMSO or MGT+IMAP (scale bar, 500 μm). Error bars indicate mean ± S.E.; #, p < 0.05; ##, p < 0.01; ###, p < 0.001; ####, p < 0.0001 compared with MGT+IMAP group; *, p < 0.05; **, p < 0.01; ***, p < 0.001; ****, p < 0.0001 compared with MGT+DMSO group.

